

Prove Your AI Investment in Product Design
Stop Guessing. Start Measuring AI Impact.

👋 Get weekly insights, tools, and templates to help you build and scale design systems. More: Design Tokens Mastery Course / YouTube / My Linkedin
"Our product design team loves the new AI tools, but how do I prove to leadership that we're delivering value?"
The design (system) world is exploding with AI. But here's the problem: most teams have no idea if the investment in AI tooling is paying off. You can easily drop thousands on AI-enhanced design systems without a single framework telling you if it's worth it.
Why This Matters Now
AI + design systems aren't a passing trend; they're already shaping how teams work.
Here are some stats:
25% of all new code is now AI-generated (Google)
AI agents resolve 85% of incoming queries (Salesforce)
$2.6–$4.4 trillion in potential global economic gains from gen AI (McKinsey)
67% of enterprise teams are using Figma's AI features (Q3 2024 report)
We don't need random metrics, but a systematic way to evaluate AI in design work.
In this post, we will go through:
Understanding AI Evals in a Design Context
The Core Metrics
Building Your Evaluation Framework
Implementation: Step-by-Step
Common Pitfalls (and How to Avoid Them)
Advanced Techniques for Mature Teams
Real-World Examples + Action Plan
1. Understanding Value Delivery for Product Design Teams
1.1 What Are AI Evals?
Think of evaluations or shorter evals like this:
You built a customer support bot. How do you know it won't tell customers to "contact a competitor" when confused? How do you know it handles edge cases? How do you know Tuesday's prompt change didn't break everything?
That's what evals do.
The basics: → Feed your AI test scenarios → Check if outputs match expectations → Get a score that tells you if you can ship
It's unit testing for AI.
Evals in the design system context are systematic methods to measure whether AI features/tools are delivering real value. Because right now we're measuring activity instead of impact. We're tracking what designers do instead of what the business achieves.
Here's the reality: Your design system isn't documentation. It's a product.
Your designers and developers are your users. And those business outcomes are the only metric that matters.
1.2 Two Ways to Measure
There are two approaches to AI evaluation in design systems:
Output-focused evals: What the AI produces (accuracy, speed, quality)
Outcome-focused evals: What humans achieve because of the AI (productivity, satisfaction, business impact)
Most teams over-index on outputs and completely miss outcomes.
2. From Design System to Business Impact
Level 1: Design System Health
✅ Time saved per component × usage frequency
✅ Hours to update vs. hours saved
✅ % of UI built with design system components (Mature design systems typically see 60 75% of UI built with design system components)
Level 2: Designer Productivity
✅ Design Time (requirement → approved)
Baseline: 3-5 days for standard features
✨ With AI: Target 1-2 days (40-60% reduction)
✅ Design Iteration Velocity (validated iterations/week)
Baseline: 2-3 iterations per designer
✨ With AI: Target 4-6 iterations (50-100% increase)
✅ Component Creation Speed
Baseline: 2-4 hours per new component
✨ With AI: Target 30-60 minutes (75-85% reduction)
Level 3: Product Delivery
Is it faster (accelerated) or not?
Time-to-Market Acceleration :
TMA = (Baseline Delivery Time - Current Delivery Time) / Baseline Delivery Time × 100✨ Target: 30-40% improvement for mature design systems
Level 4: User Experience Impact
✅ Consistency Score (low deviation rate)
✅ Task Completion Rate
✅ Less Support Tickets
✅ Add your own
Level 5: Business Outcomes
✅ Faster feature validation
✅ Lower design/dev time per feature
✅ Differentiated, consistent experiences
✅ Add your own
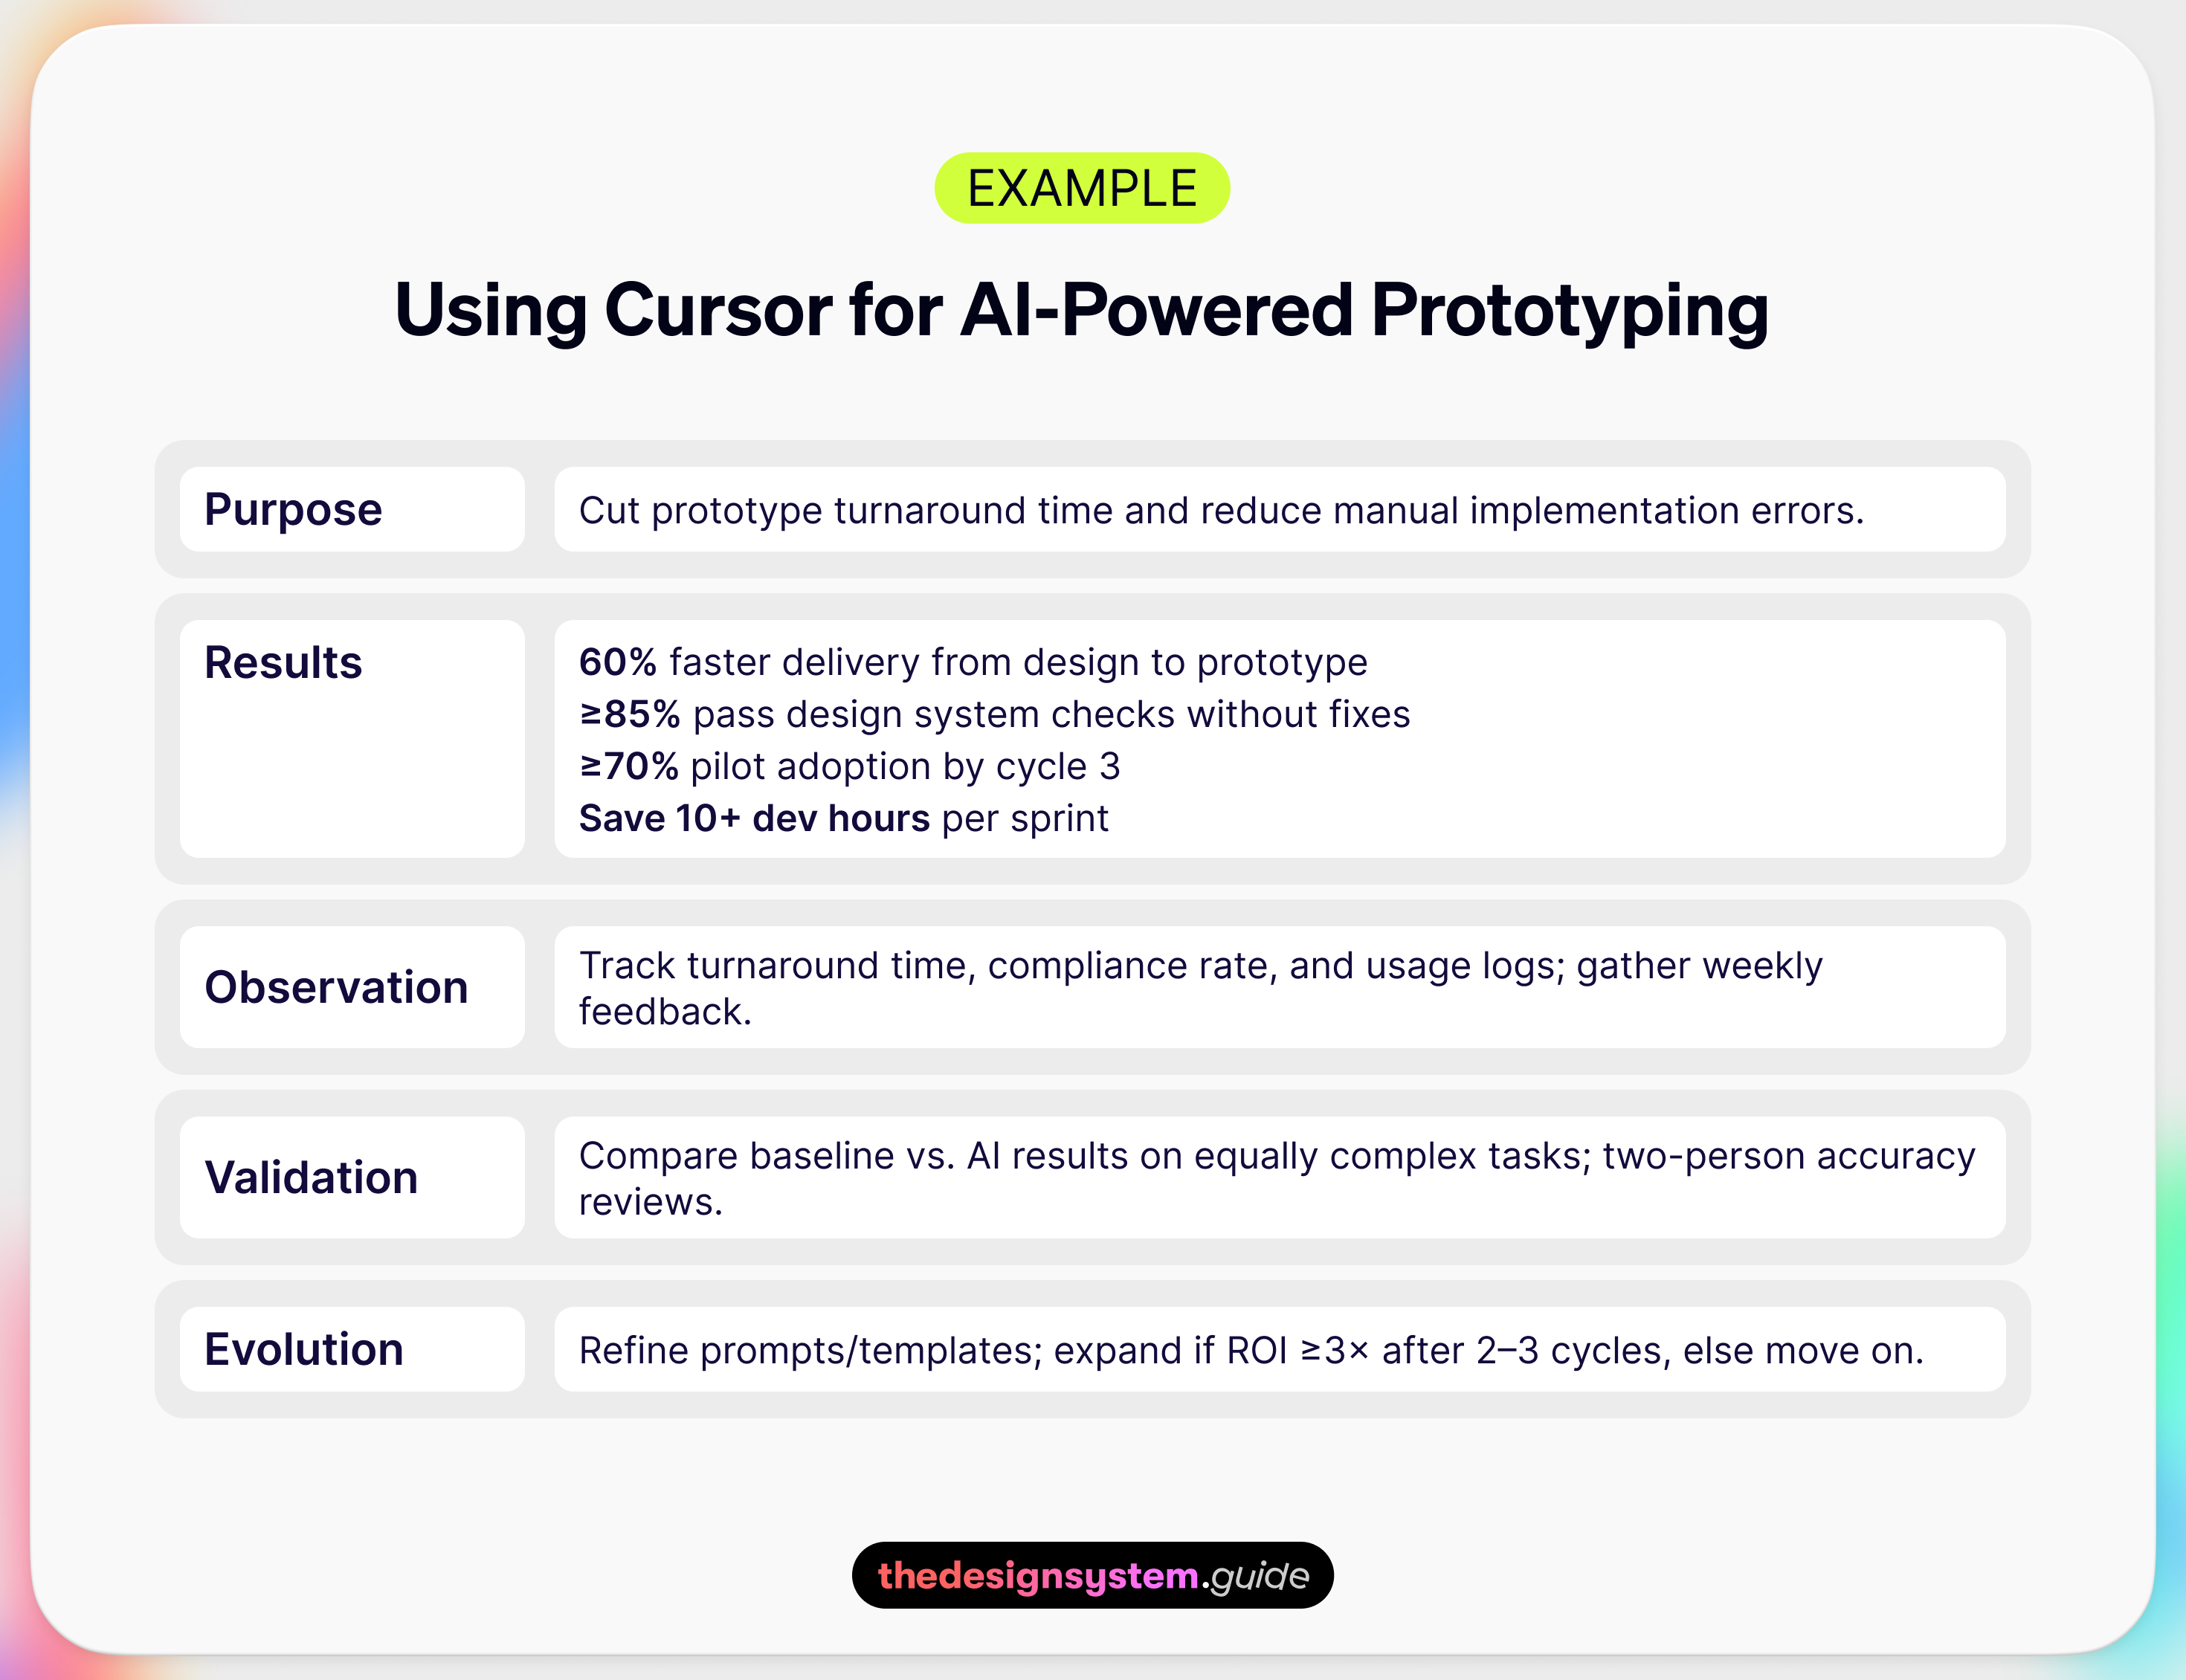
So, where to start? Add answers to these five sections: Purpose, Results, Observation, Validation, and Evolution. 👇
3. Evaluation Framework
Purpose: What problem are we trying to solve? Start by clearly defining the actual issue this AI feature addresses.
Results: How do we know if it's working? Figure out what success looks like - with real numbers and concrete outcomes we can measure.
Observation: How do we track? Gather data. Either automatic, either manually adding to Airtable, Sheets, or anything else.
Validation: Can we trust our data? Make sure the information we're collecting is actually reliable and accurate.
Evolution: What happens when things change? How fast can we adjust our approach/direction?
3.2 What is Your Baseline?
Measure everything before rolling out AI:
✅ Current design completion times
✅ Design-to-Development Handoff
✅ Component reuse rates
✅ Design Iteration Velocity
✅ Designer satisfaction scores (baseline: 6-7/10 on tool satisfaction)
📌 Run this for at least 4 weeks, so the results are not random.
4. Implementation: Fast cycle
AI moves too fast for year-long measurement plans. Your eval loop should run in weeks, not months. ‼️
Step 1: Foundation
Define your North Star metric
Set up tracking in tools you already use (Airtable, Amplitude, Mixpanel, GA4).
Avoid building custom infra unless absolutely necessary.
Step 2: Pilot Fast
Roll out to a small, representative group (5–15% of your team)
Mix skill levels, roles, and use cases.
Don't just pick your power users — they're not the real test.
Step 3: Data + Feedback
Automated tracking daily (usage, completion time, accuracy)
Qualitative check-ins weekly (quick surveys, short interviews)
Cross-functional reviews every 1–2 weeks
💡 Example survey questions:
- When the AI didn't work as you expected? Explain.
- Did the AI tool XY change your workflow? For better or worse?
- Describe a task that the AI makes more difficult or time-consuming.
Step 4: Analyze & Act
Look for practical wins, not perfect stats.
Identify unexpected use cases or failure points; these often lead to your best improvements.
Ship adjustments immediately, don't wait for "final results."
Step 5: Repeat the Loop
Each cycle = Launch → Measure → Adjust → Relaunch
Keep cycles short (2–4 weeks)
After 2–3 cycles, you'll have enough data to present clear results to leadership and decide whether to scale.
5. Common traps
Too many tools
Don't implement a bunch of AI tools just because competitors have them. Think about the problem, experiment with tools, and then scale.
Vanity metrics
Every metric should tie to a business outcome.
Set up and forget
Not iterating based on eval results.
Schedule monthly review sessions, no exceptions.
Perfect results
Waiting for perfect measurement before acting.
Start with 80% confidence, iterate from there.
6. ROI?
If your ROI isn't trending toward ≥ 3× within 2–3 cycles, it's time to rethink.
7. Example
How I'd experiment with Cursor for AI-powered prototyping
Example numbers:
Prototype creation: From 4-6 hours → 1-2 hours (66% reduction)
Component accuracy: 70-80% match to the design system on the first generation
Iteration cycles: From 5-6 rounds → 2-3 rounds of refinement
Weekly velocity: From 3 prototypes → 8-10 prototypes per designer
Your Action Plan
Define your North Star metric
Audit current metrics (what are you already tracking?)
Set up basic tracking for at least one AI feature
Run a baseline measurement sprint
Create your evaluation framework
Start your pilot program
Complete the first full evaluation cycle
Present findings to leadership
Iterate based on data
In short, the goal is to build better components, prototypes, and products faster. AI is just one way to get there, and evals tell you if it's working. 🙌
Enjoy exploring. ✌️
— If you enjoyed this post, please tap the Like button below 💛 Thank you.
💎 Community Gems
Behind Wolt’s New Icons: Designing a System That Scales
*Launched today
🔗 Link
“Beyond Chat? Future of AI Design” (Podcast + Video) with Vitaly Friedman
🔗 Link
Summer AI inspiration links for designers
🔗 Link